What Is Perfect Racer? The 30-Second Balance Game, Explained
By Shaun Cheon
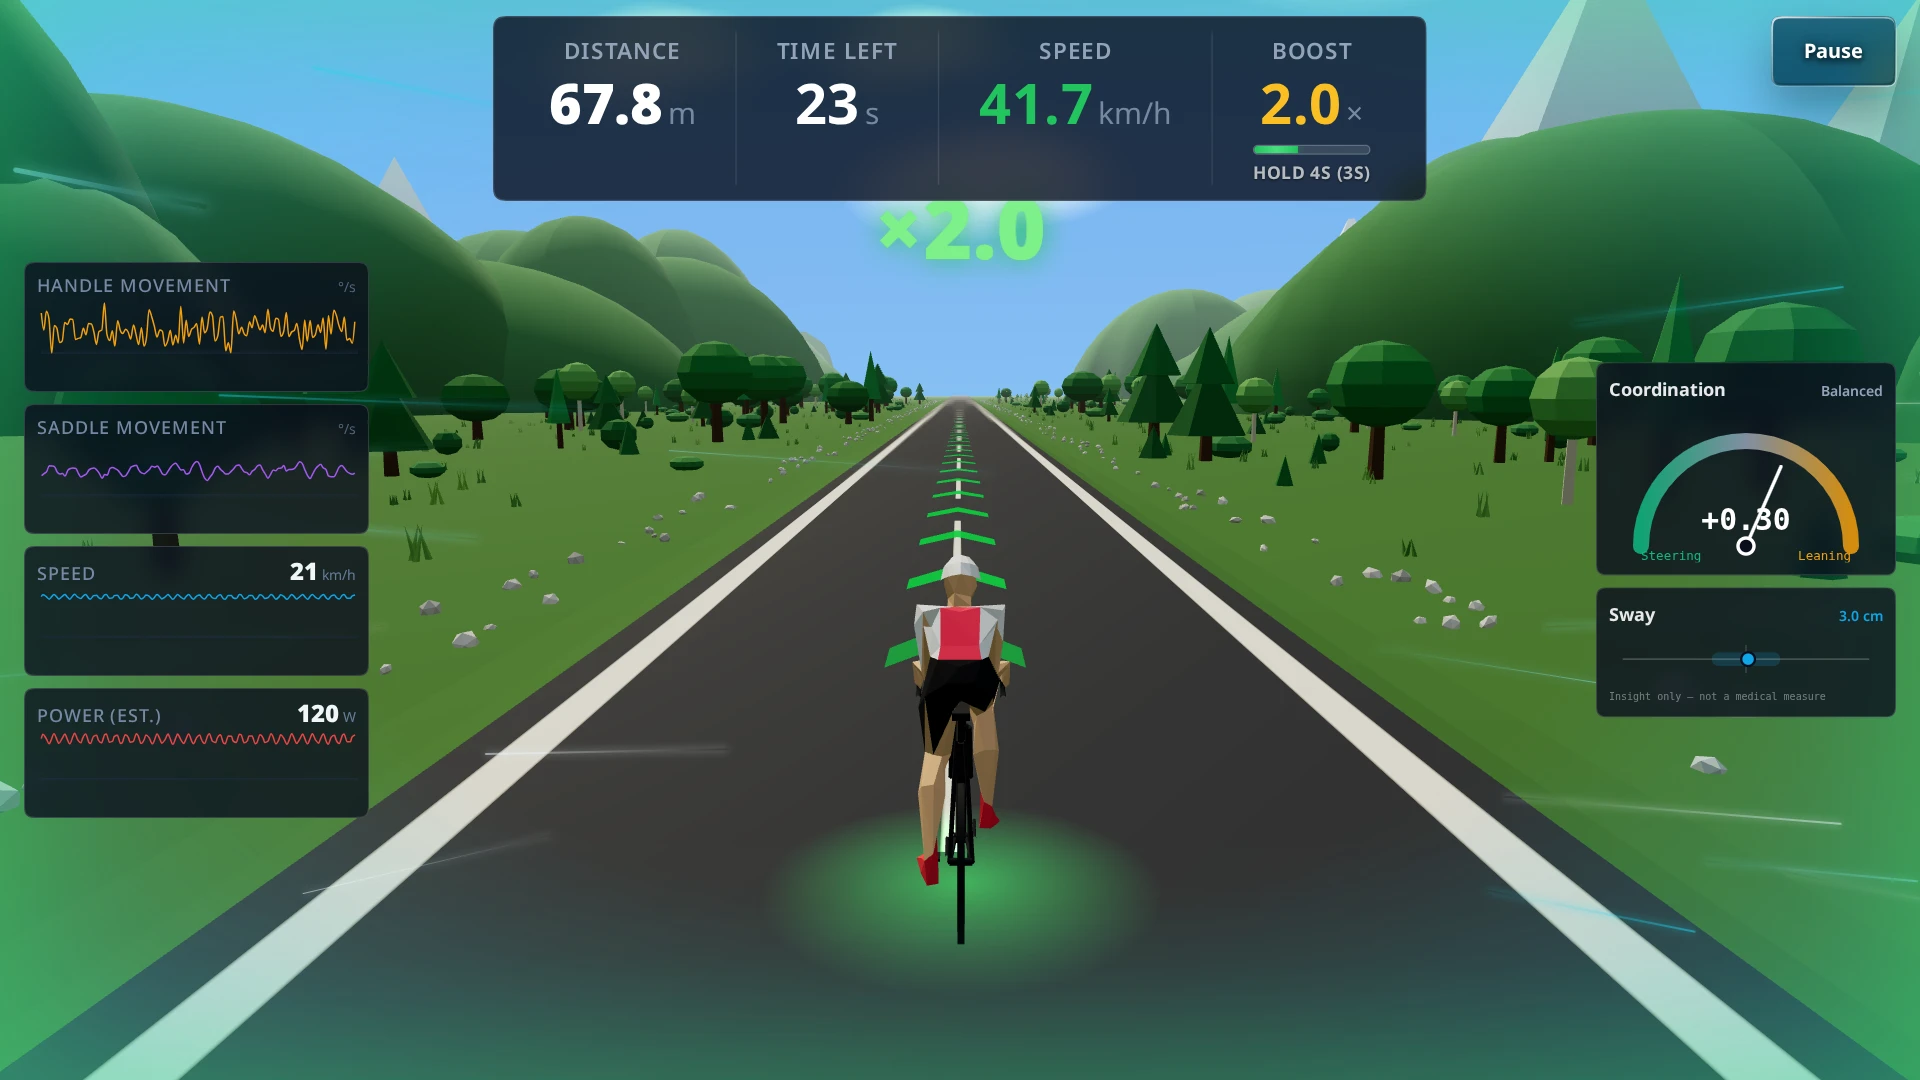
The short version: Perfect Racer is the 30-second challenge on Ultiracer kiosks. You ride a real bike that sways and steers, and your one job is to keep it in the middle of the road on screen. Stay centered and you earn a speed boost; stay centered longer and the boost grows to 3×. The game grew out of research at Korea University, where short, centered rides on Ultiracer turned out to reveal a lot about how a person keeps a bike upright. We kept the research's task and the same kind of measures, built a game around them, and now a ride ends with a picture of your balance and coordination. Here is where it came from, how it works, why a steady rider can beat a fast one, and what more than 4,000 rides show about how different age groups ride.
Where it started: three 30-second rides at Korea University
Perfect Racer did not begin as a game. It began as a research task.
Researchers at Korea University used Ultiracer to study how people keep their balance on a bike. Ultiracer is not a fixed exercise bike: the rider's bicycle sits on rollers and a sliding base, so it sways and tilts like a bike on the road, while the platform keeps the rider from falling. Each participant rode three 30-second rounds at a comfortable pace, trying to keep a marker on the center line of a game-style screen. Sensors recorded the bike's speed, its side-to-side position, and the forces at the handlebars and the saddle (Kang et al., 2025; Kim et al., 2025).
The two studies compared people with mostly mild Parkinson's disease and healthy adults of a similar age. Two of their findings shaped what we built next:
- Short rides carry a lot of information. Measures from those 30-second rounds told the two groups apart well. In the companion AI study, even a two-second slice of riding carried a useful signal, and the bike's side-to-side drift was the most informative signal of all.
- How you balance matters, not just how much you wobble. Riders with Parkinson's actually swayed less than the healthy riders (17.1 mm against 22.8 mm), yet they balanced differently. A new measure, the Handle-Saddle Coordination Index, showed whether a rider leaned and steered as one unit or used the handlebars to counter a lean.
Perfect Racer is not a medical test and does not look for any condition. What we took from the research is the format and the kind of measures. Our view is that a short, centered ride is a practical way to practice balance and coordination, and to see how they change over time.
From the lab to the kiosk
We kept the core of the research task and built a game around it:
- The same task. Keep the bike in the middle of the road for 30 seconds, at your own pace.
- The same kind of measures. How far the bike drifts from center, how steady the frame and handlebars stay, and how steering and leaning work together. On our kiosks we measure these from the motion of the handlebars and the bike frame.
- A reason to ride again. Scenes from Seoul and Dubai to alpine valleys and country roads, a speed boost for staying centered, tiers from E to S, leaderboards, and a results screen that explains your ride in plain words.
Because it takes well under a minute, Perfect Racer has become a favorite at events: queues move quickly, and riders can come back to beat their own distance.
One loop, running the whole ride
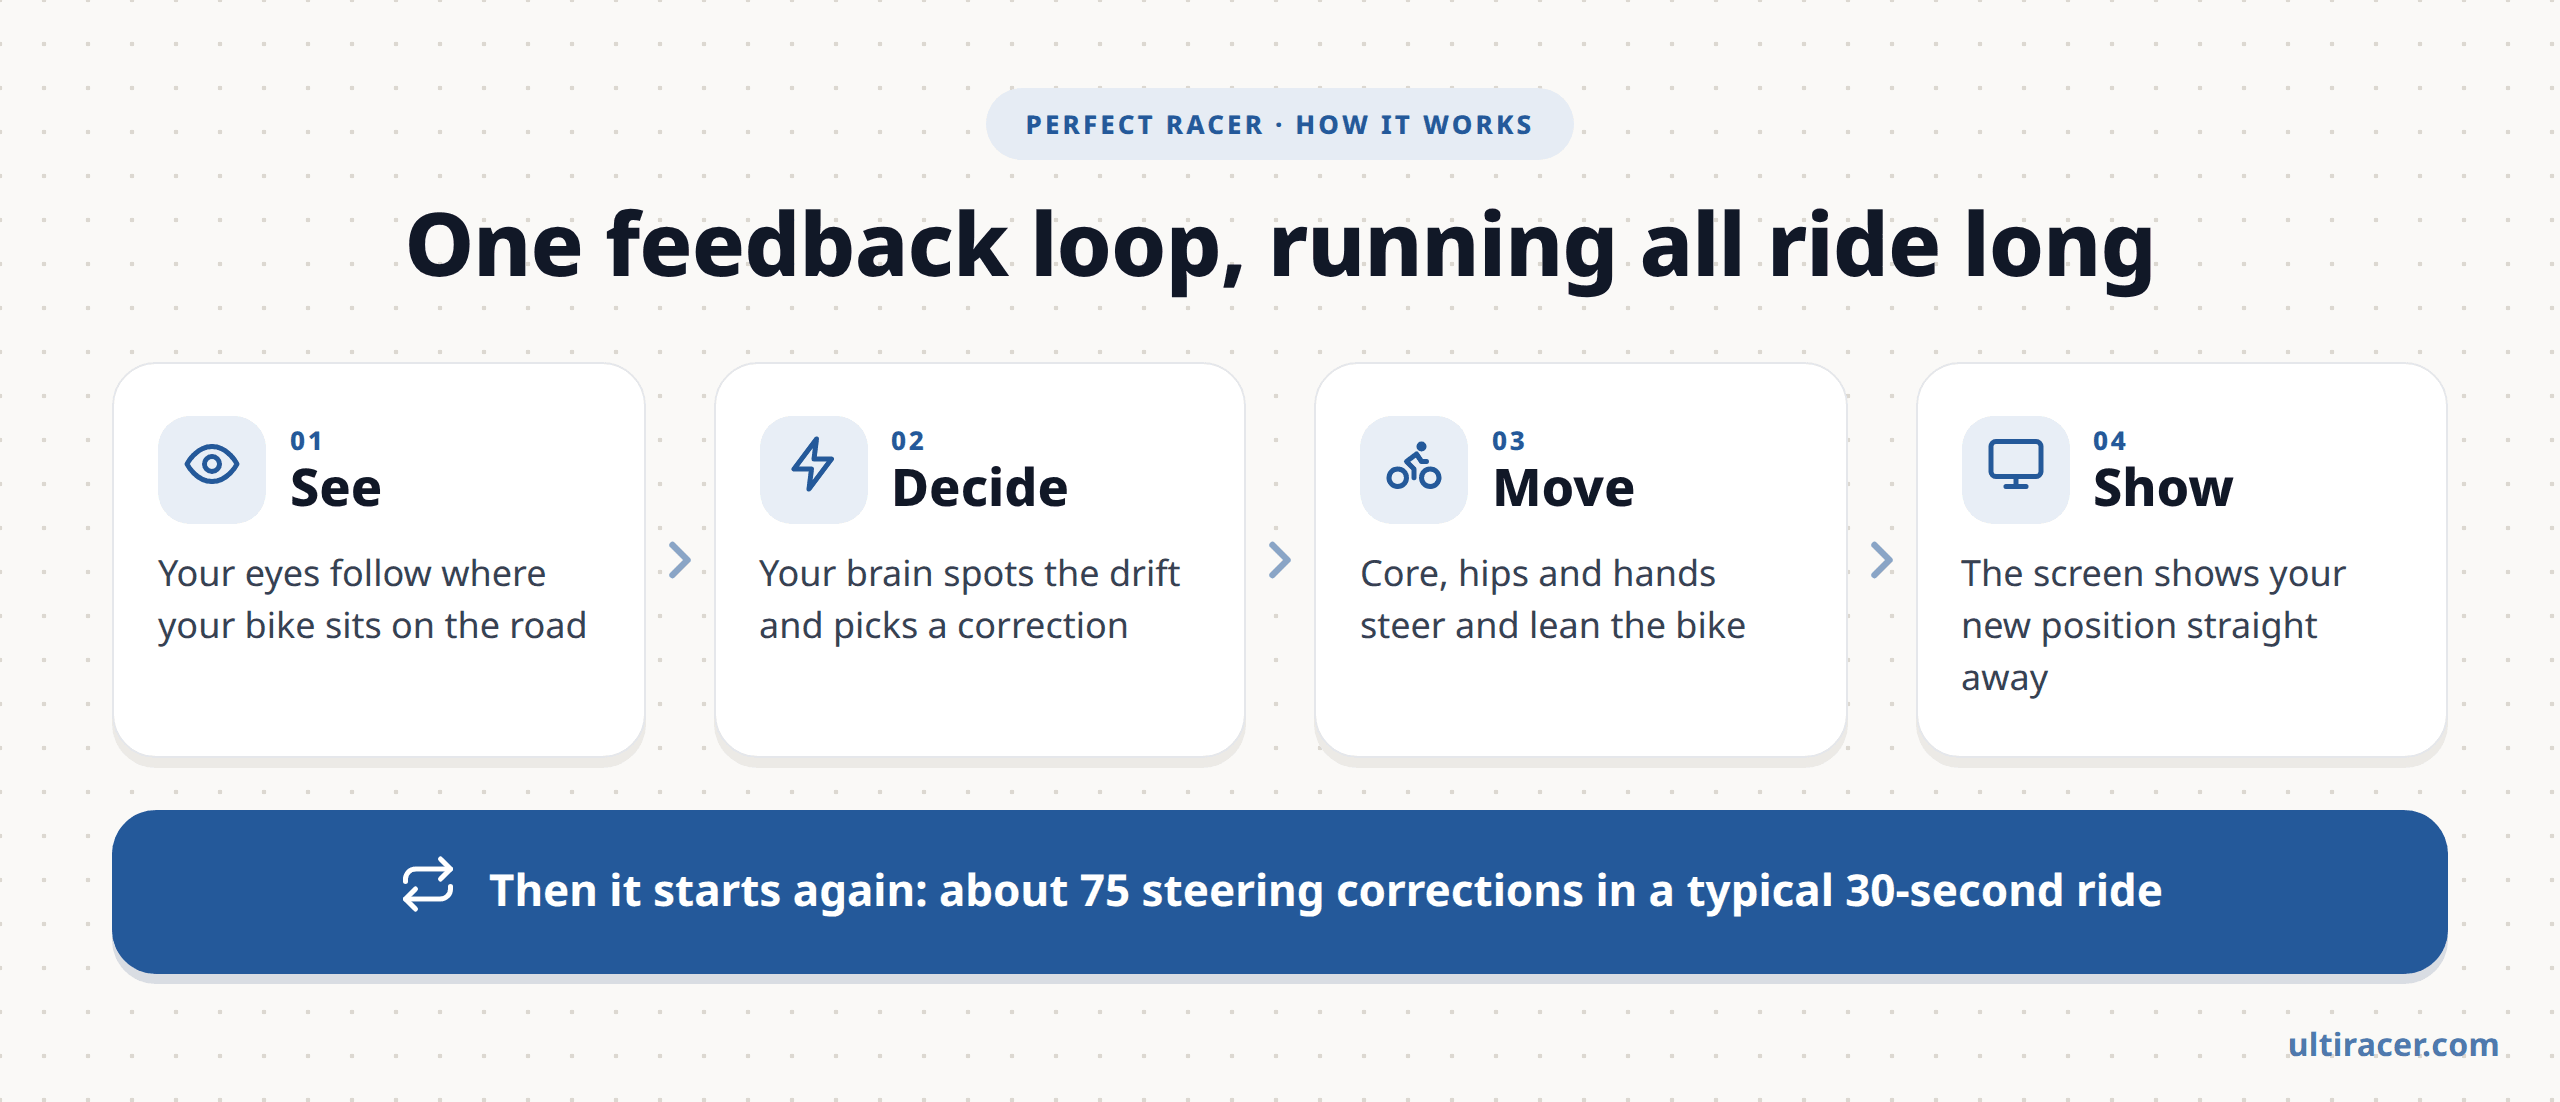
Every second of Perfect Racer runs the same loop:
- See. Your eyes follow where your bike sits on the road, and the screen shows a drift the moment it starts.
- Decide. Your brain picks a correction: how much to steer, how much to shift your weight.
- Move. Your core, hips and hands carry it out, steering and leaning the real bike.
- Show. The screen shows your new position straight away, and the loop starts again.
Because the bike really moves, every correction counts and every overcorrection shows. In a typical 30-second ride on our kiosks, riders change steering direction about 75 times. That constant cycle of looking, deciding and adjusting is what keeps riders so focused, and it is exactly the practice that balance and coordination need: real-time corrections, repeated until they become smaller and smoother.
How the game works, in plain words
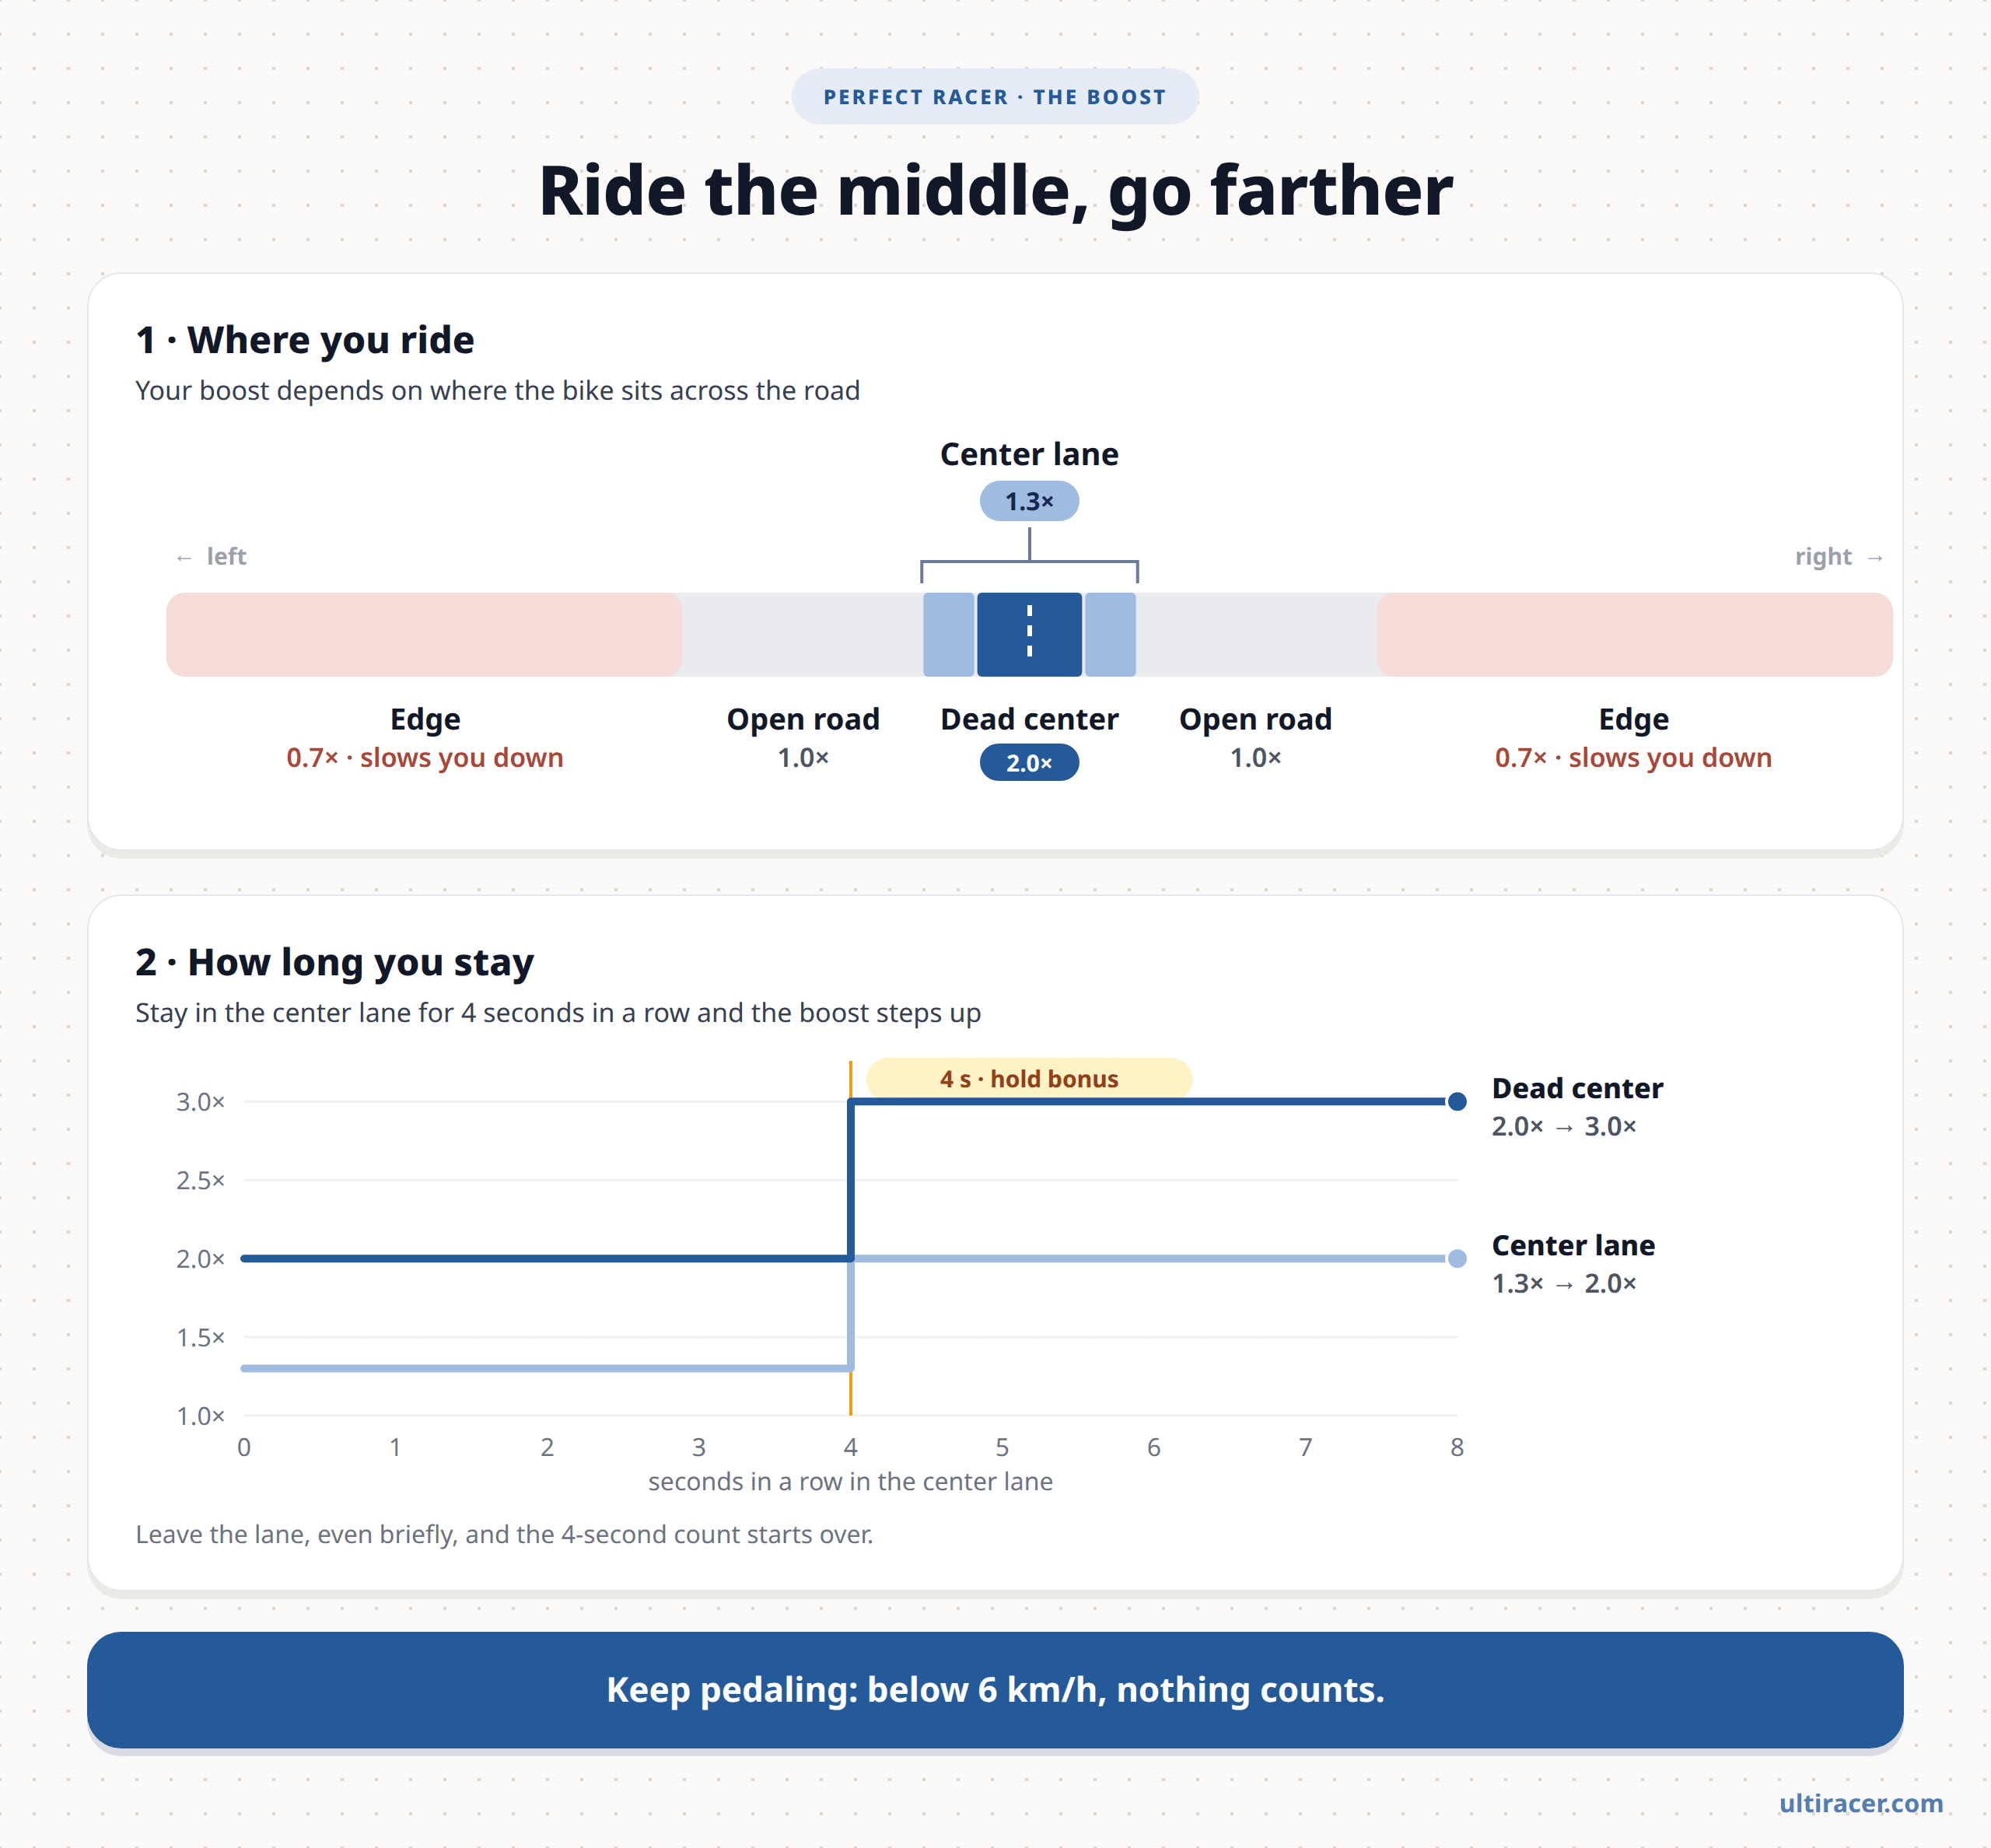
Perfect Racer is scored on distance. The faster you pedal, the farther you go, but where you ride matters just as much:
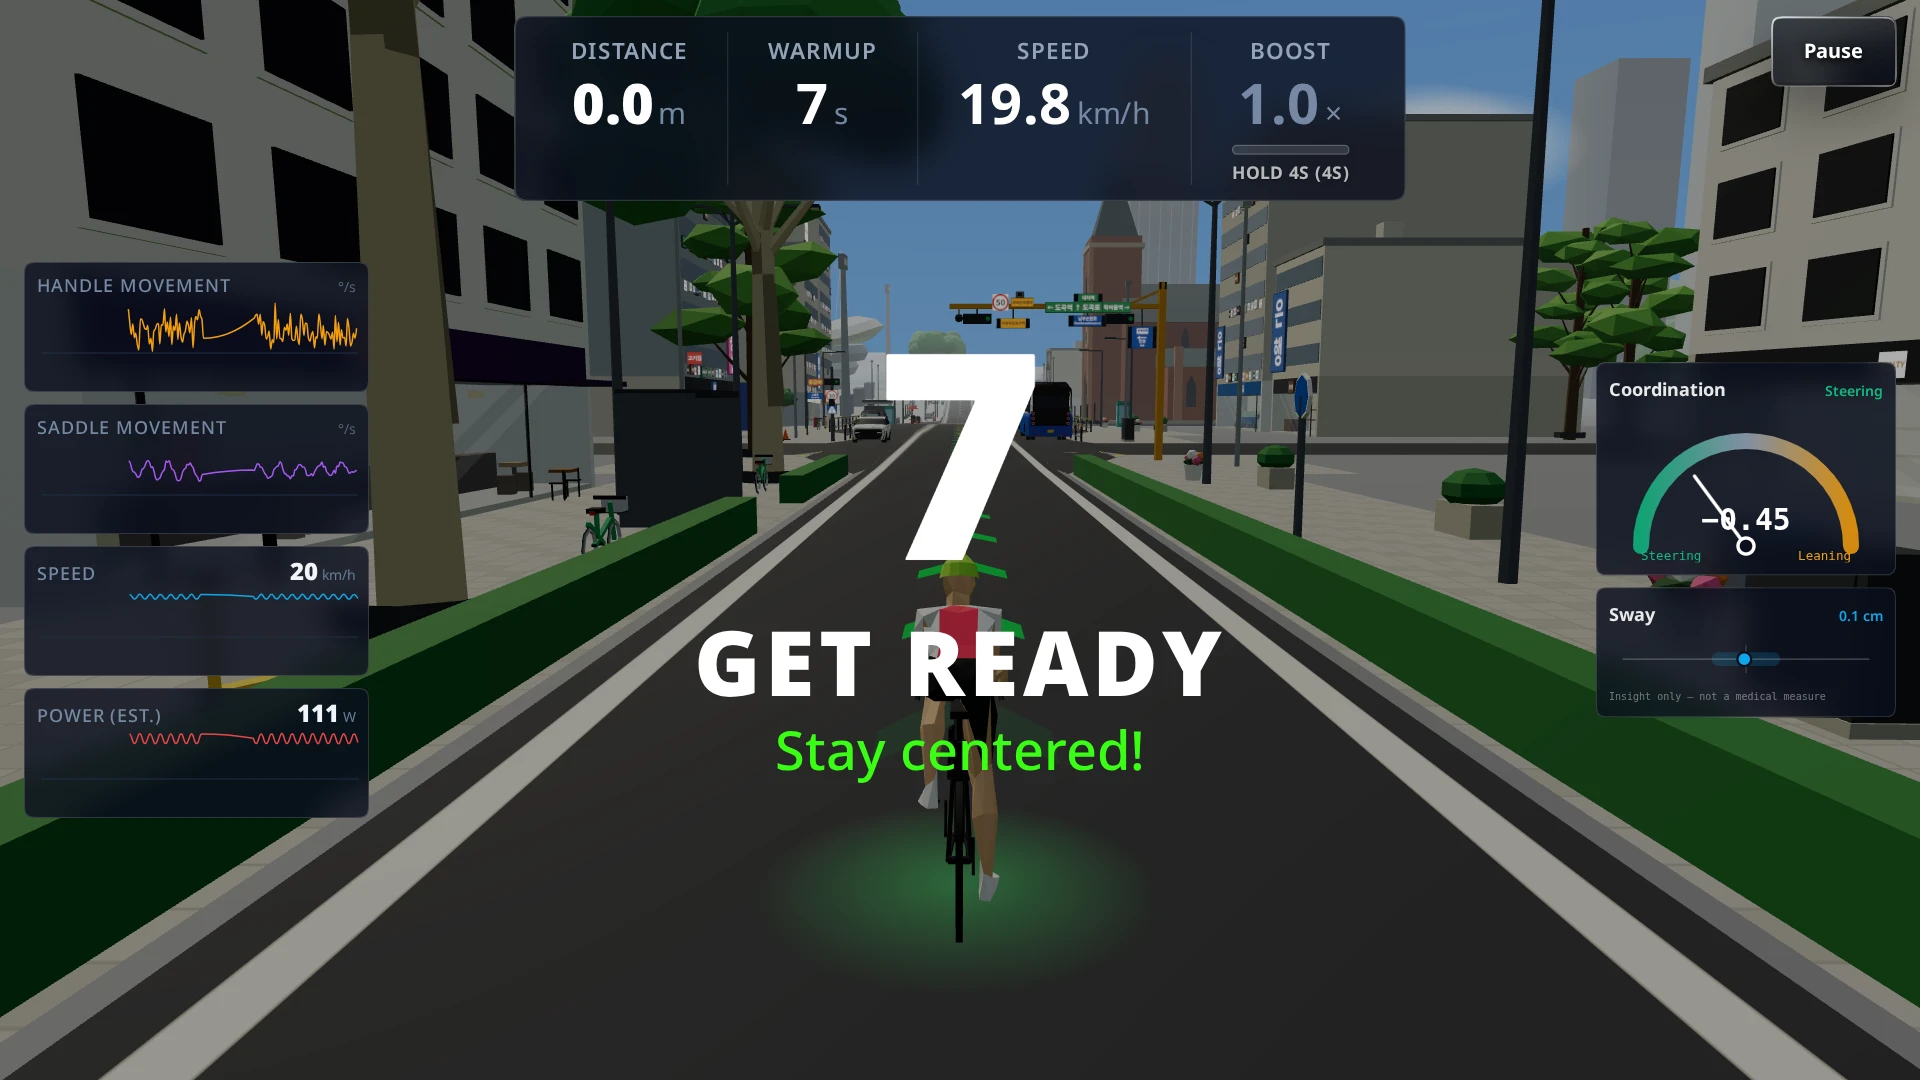
- Warm up first. A 10-second countdown, timed to the music, gets you pedaling before the clock starts. Then you have 30 seconds.
- Ride the center lane for a boost. Inside the narrow center lane, your speed counts 1.3 times. In the very middle of the lane, along the center line (dead center), it counts double.
- Stay there for a bigger boost. Hold the center lane for 4 seconds in a row and the boost steps up: 2× in the lane, 3× at dead center. Time anywhere in the lane counts toward the 4 seconds, so moving between the lane and dead center does not reset it. A bar fills while you hold and turns gold when the bonus kicks in.
- Drift out and the count starts over. Leave the lane, even for a moment, and the 4-second count restarts from zero.
- Avoid the edges. Drift far toward either side and your speed counts only 0.7 times until you come back.
- Keep pedaling. Below 6 km/h, nothing counts.
Why a steady rider can beat a fast one
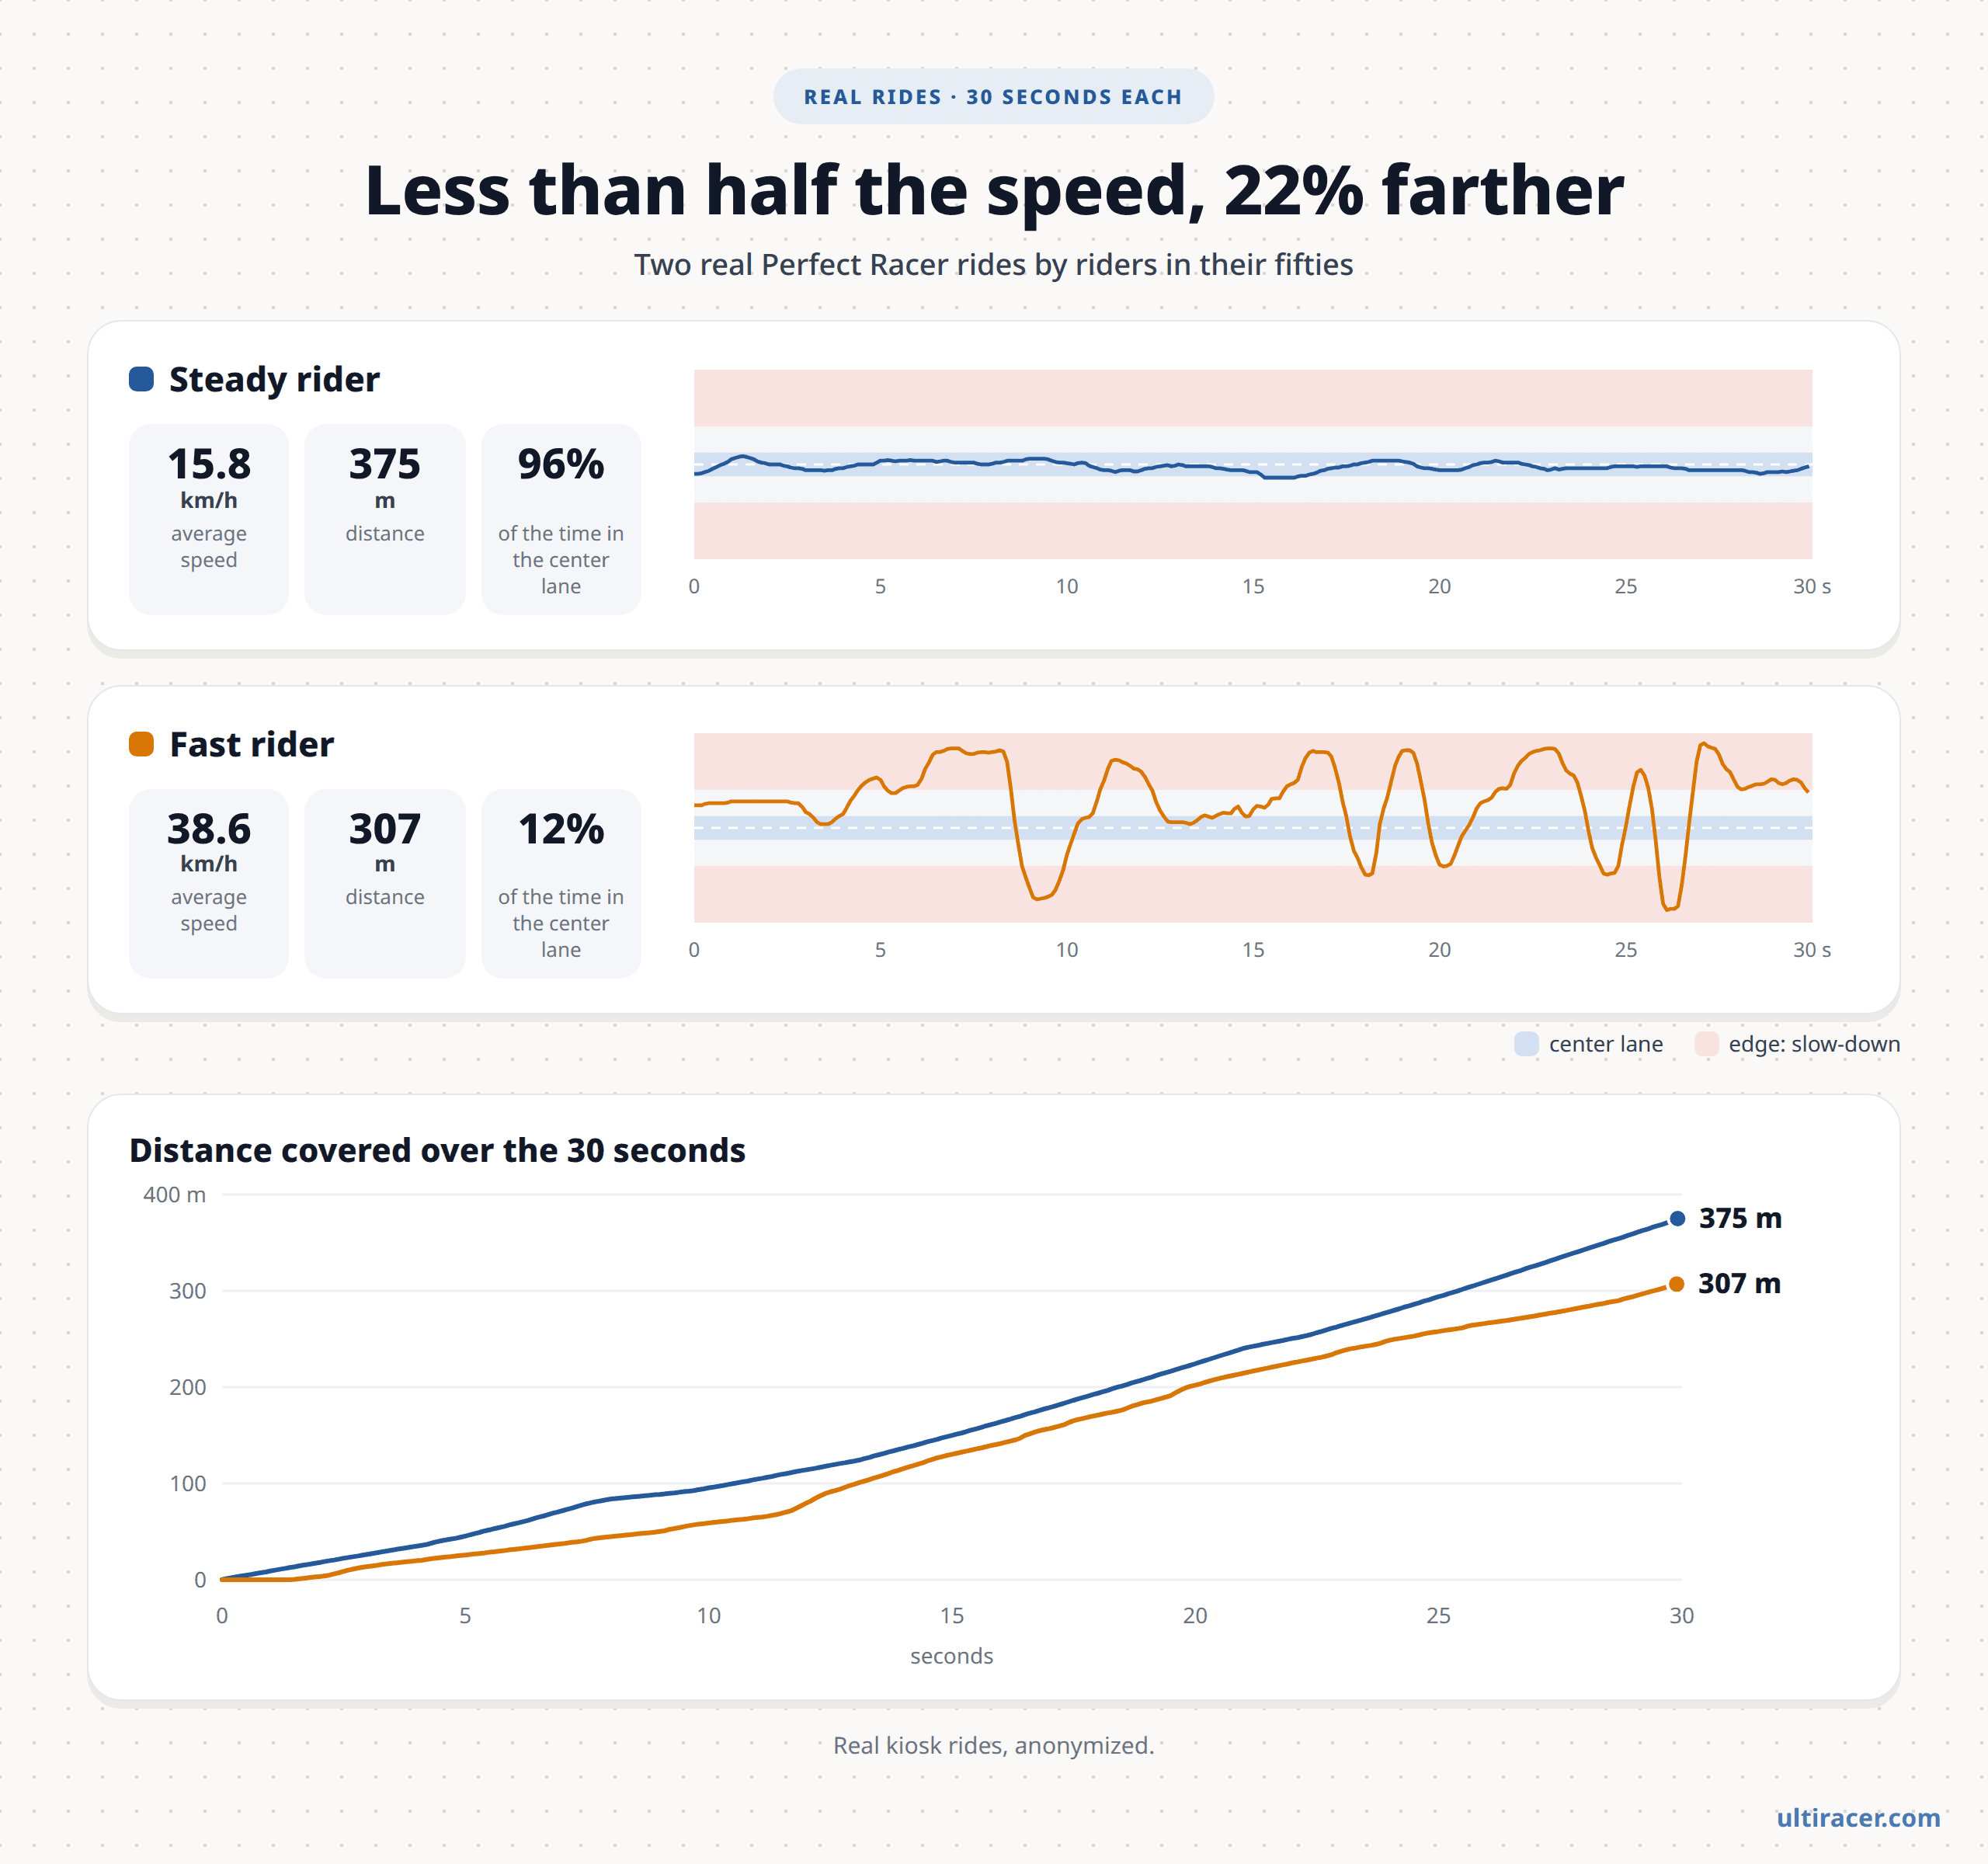
The boost makes control worth more than raw power. The chart above shows two real kiosk rides by riders in their fifties. One averaged 38.6 km/h but spent only 12% of the ride in the center lane and more than half of it near the edges, where speed counts for less. The other averaged 15.8 km/h, less than half as fast, but stayed in the center lane 96% of the time and spent most of the ride at the higher boosts. The steady rider finished with 375 m, 22% farther.
That is the idea behind the game. Keeping a moving bike upright is a whole-body skill: riders balance by steering, leaning their upper body and moving their knees (Cain et al., 2016). A stable core keeps the upper body quiet, the hips keep the pedal stroke smooth, and the hands make small, well-timed steering corrections. Pushing harder on the pedals does not help if every push sends the bike sideways. Perfect Racer rewards the riders who coordinate, not only the ones who pedal hardest.
What a ride measures
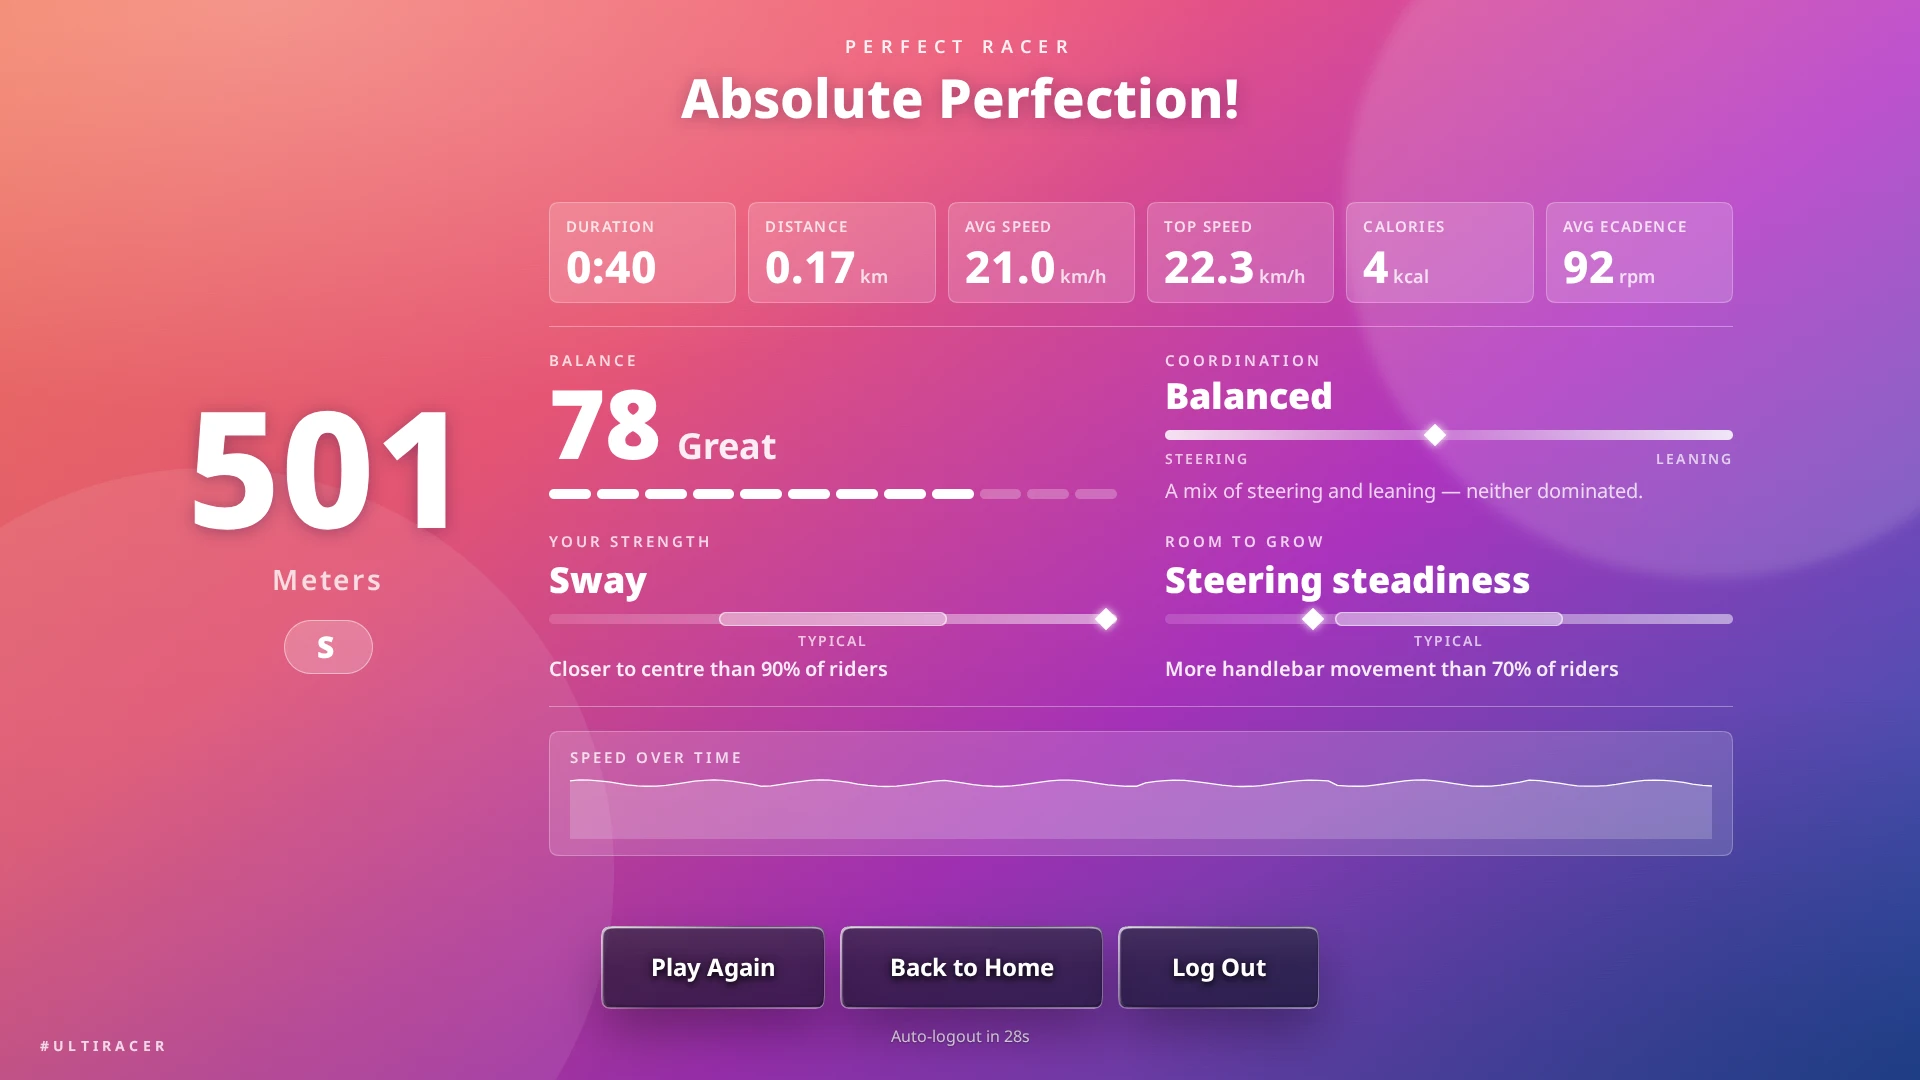
When the 30 seconds are up, the results screen shows your distance and tier, along with the ride's duration, average and top speed, calories and cadence. When the sensors have captured the whole ride, it adds a balance and coordination summary:
- Balance Quality (0 to 100): your overall steadiness. It combines how far the bike drifted from center, how much the frame wobbled from side to side, how quickly the lean changed and how often you changed steering direction.
- Coordination: whether you kept your balance mainly by steering, mainly by leaning, or with a mix of both.
- Your strength and room to grow: out of four steadiness measures (sway, lean steadiness, steering steadiness and steering economy), the one where you did best and the one with the most room to improve, each compared with other riders.
These numbers are insights for comparing your own rides over time, not a medical assessment.
The Handle-Saddle Coordination Index, explained
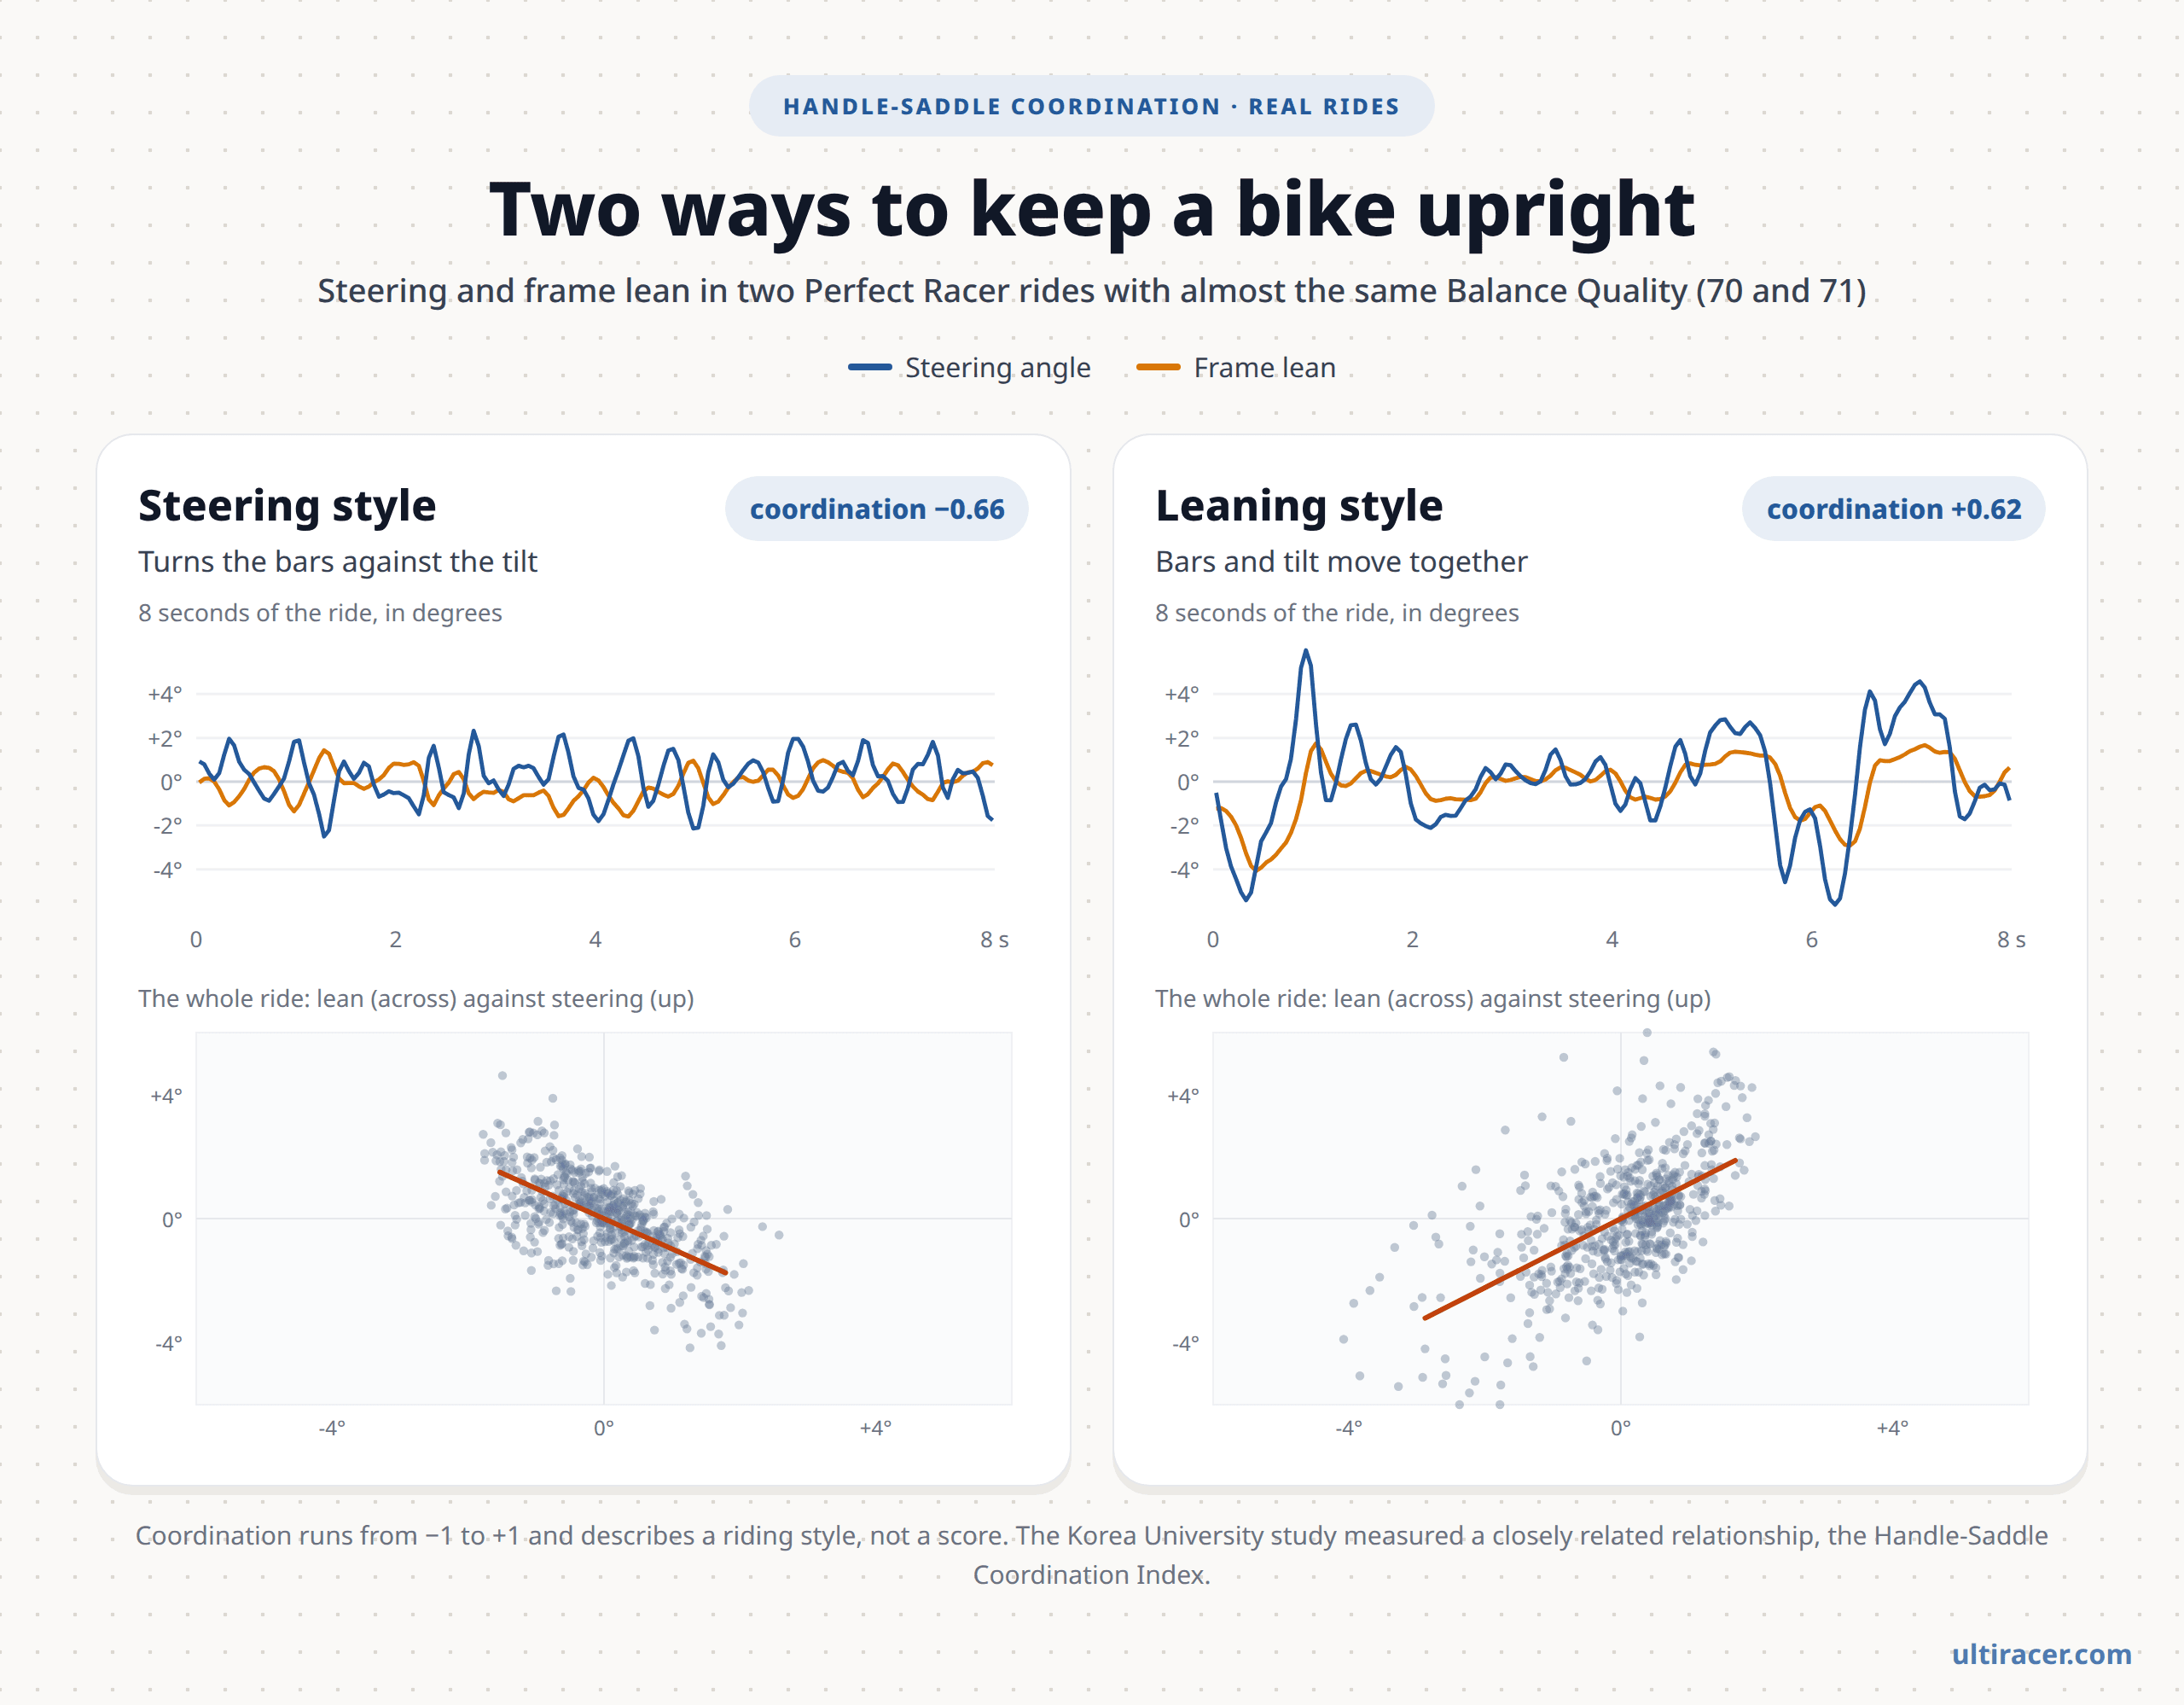
The idea from the Korea University research that we find most interesting is the Handle-Saddle Coordination Index. When a bike starts to tip, you can respond in two broad ways. You can turn the handlebars against the tilt to bring the bike back under you, using steering and body lean as separate tools. Or you can lean and steer together, with the handlebars and hips moving as one block.
The researchers measured this by comparing the forces at the handlebars with the forces at the saddle, moment by moment. When the two move in the same direction, the index is positive: rider and bike move as one. When they move in opposite directions, it is negative: the steering counters the lean. In the study, healthy older adults averaged 0.11, close to neutral, while riders with mild Parkinson's averaged 0.47, a coupled style that earlier research had also seen in beginner cyclists (Cain et al., 2016). Within the Parkinson's group, a more coupled style went with worse walking measures (Kang et al., 2025).
Why it matters: two riders can wobble the same amount and still balance in different ways. The index captures the strategy, not just the result. On Ultiracer kiosks we measure the same relationship from the turning of the handlebars and the lean of the frame, on a scale from −1 to +1. The two rides in the chart above have almost the same Balance Quality (70 and 71) but opposite styles: one turns the bars against the tilt (−0.66), the other moves bars and lean together (+0.62). We report coordination as a riding style, never as a score, because neither style is right or wrong on its own. Our measure is a motion-based cousin of the study's force-based index, and the style of a single ride says nothing about anyone's health.
Why even 30 seconds matters
It is easy to think a 30-second ride is too short to count. The research suggests otherwise. In the Korea University studies, three 30-second rounds were enough for the ride measures to tell groups of riders apart, and even two seconds of riding carried a useful signal (Kim et al., 2025).
A single ride is also real practice. With about 75 changes of steering direction in a typical ride, every 30 seconds holds dozens of repetitions of the look, decide and move loop. And because a ride takes so little time, it is easy to repeat: a few rides in one visit, or one ride every visit, build into a record of how your balance and coordination change over weeks and months. For people who would never sign up for a long workout, 30 seconds is an easy yes.
How each age group rides Perfect Racer
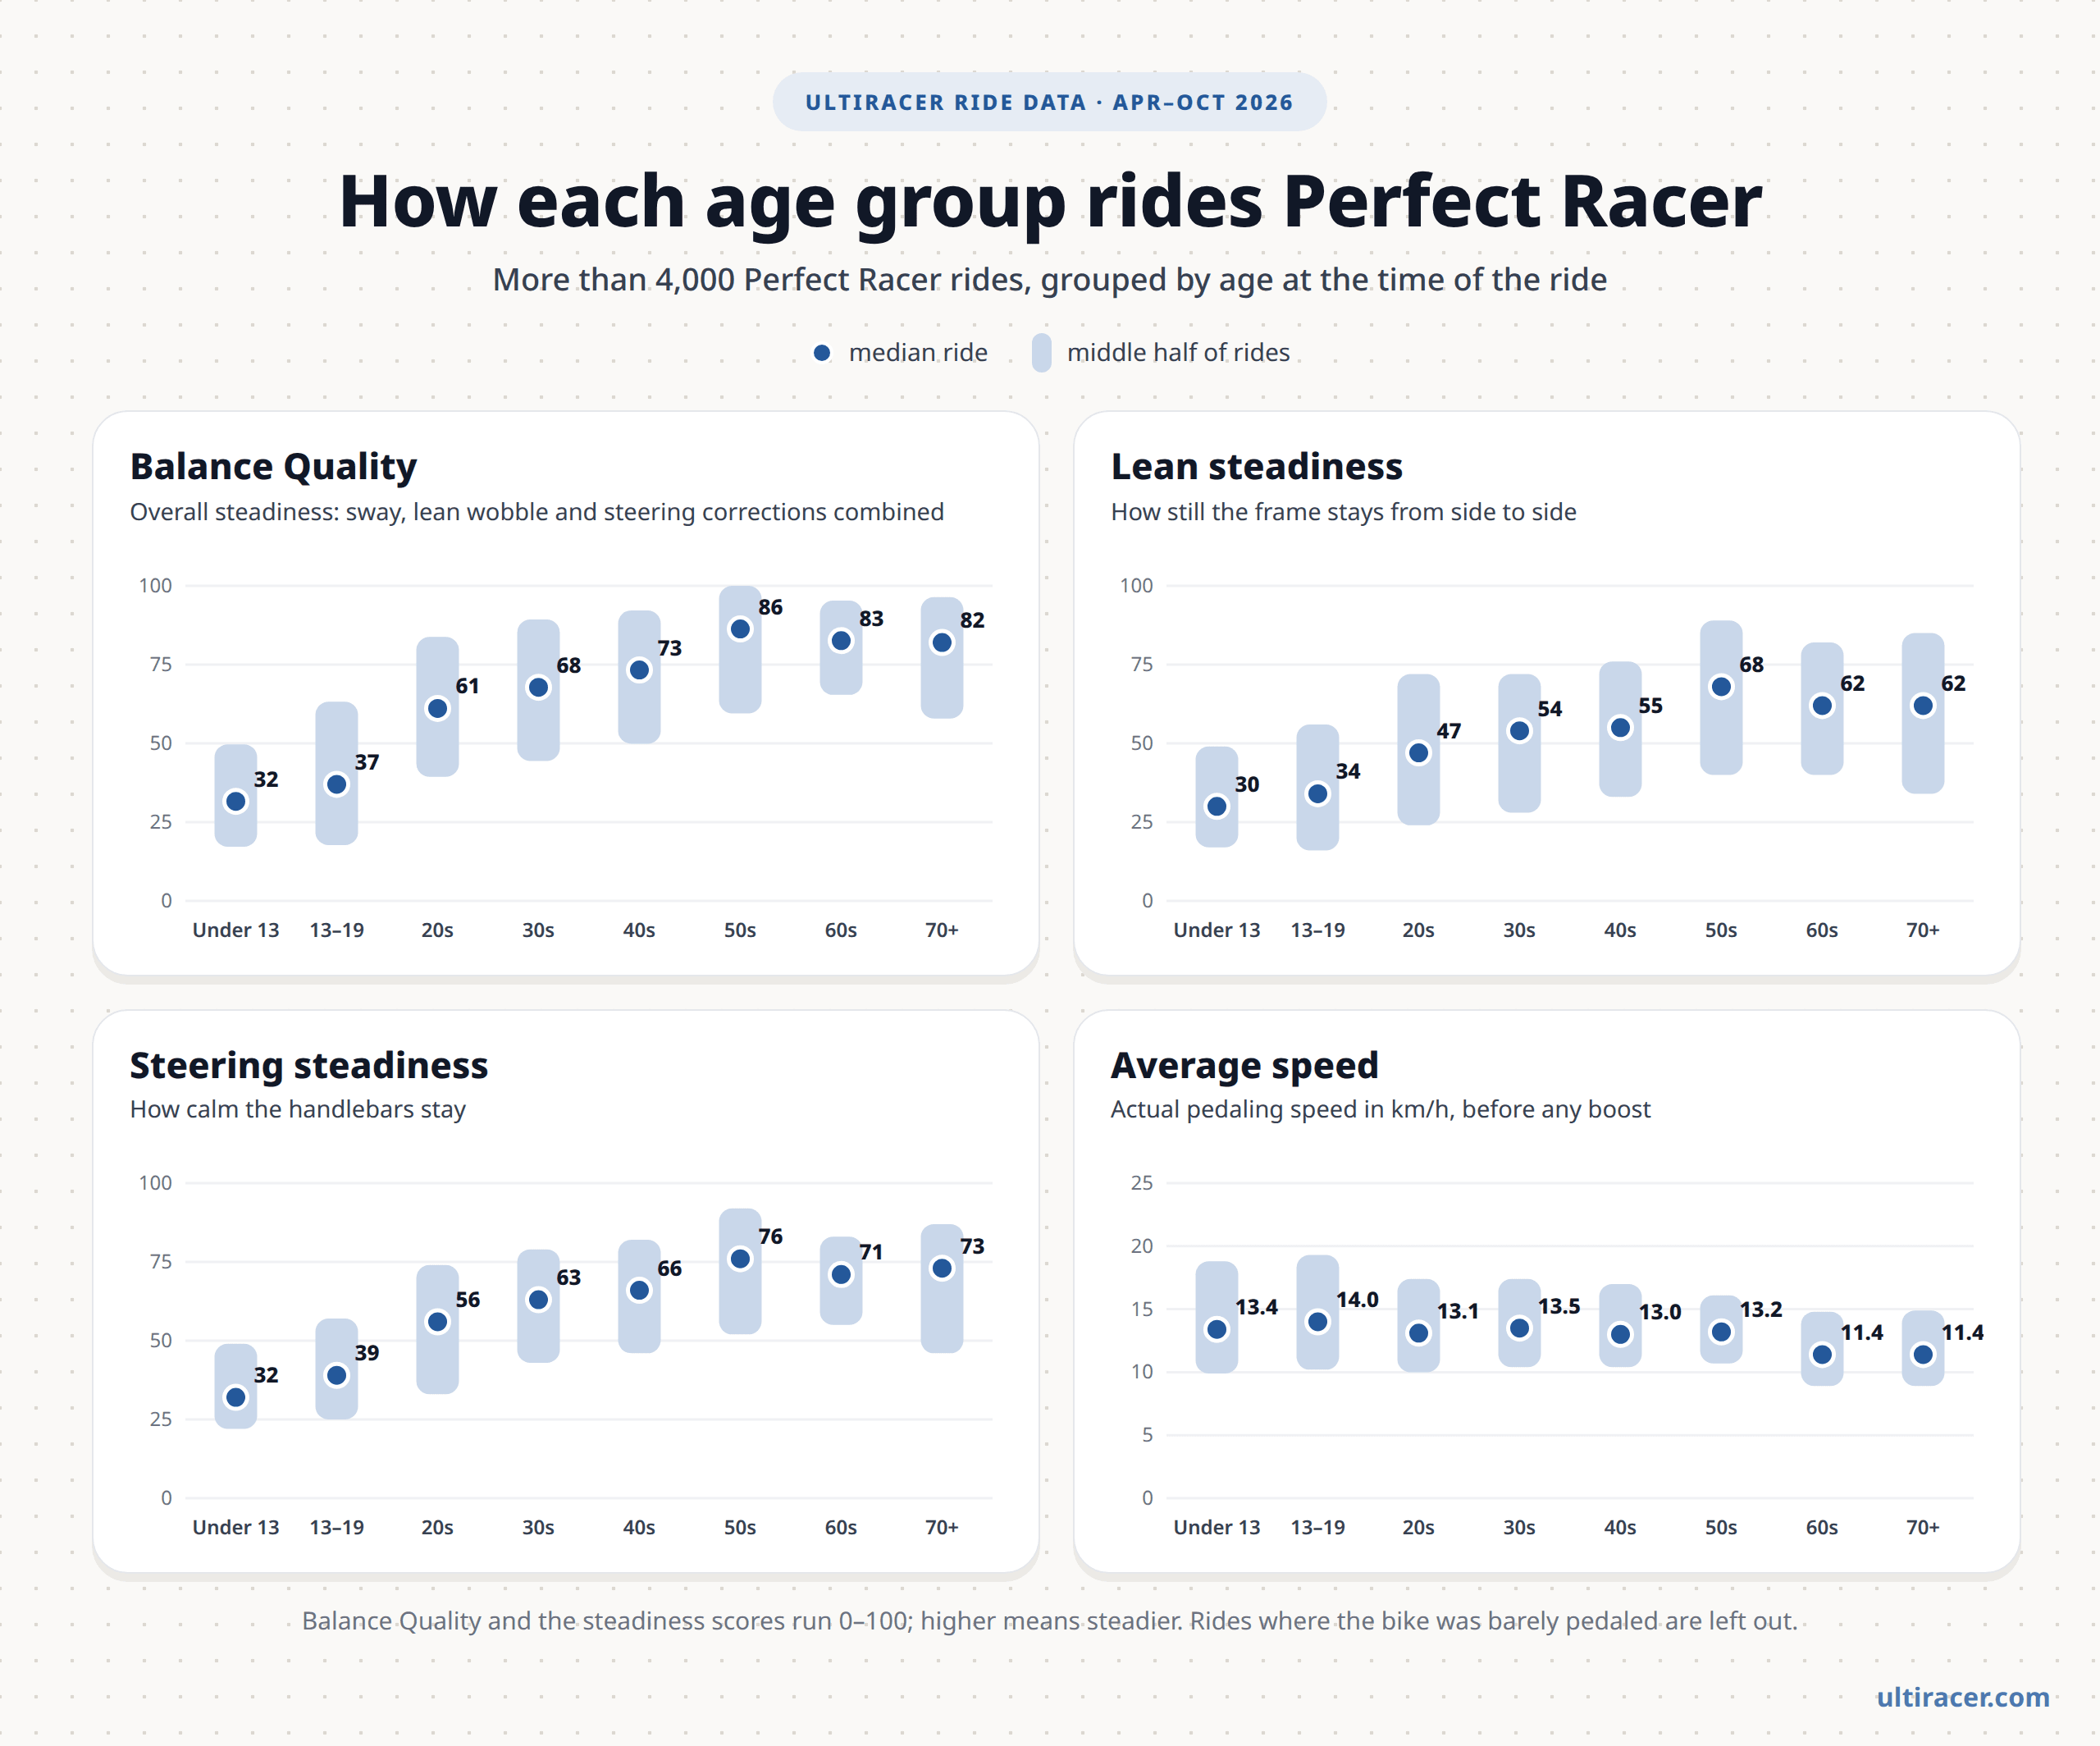
We looked at more than 4,000 Perfect Racer rides on Ultiracer between April and October 2026 in which the sensors captured the whole ride and the rider kept pedaling (an average of at least 6 km/h), and grouped them by each rider's age at the time of the ride. Here is what the data shows:
- Balance Quality is higher in each older group up to the 50s. The median goes from 32 for riders under 13 and 37 for 13 to 19 year olds, to 61 in the 20s, 68 in the 30s, 73 in the 40s and 86 in the 50s. Lean steadiness and steering steadiness follow the same pattern.
- Riders in their 60s and those aged 70 and over sit close to riders in their 50s. Their medians, 83 and 82, are higher than those of riders in their 20s, 30s and 40s.
- Riders aged 60 and over rode at a slower pace. Their typical average speed was about 11 km/h, against 13 to 14 km/h in the other groups.
- Coordination styles differ. About 1 in 5 rides by riders under 13 showed a clear leaning style, against about 1 in 10 or fewer in every other group. From the 30s onward, about 4 in 10 rides showed a clear steering style. The style figures for riders under 13 may not be accurate, though: not every young rider had a properly fitted bike, and on some the saddle was set too high for them.
- The spread inside each group is wide. The middle half of rides spans roughly 30 to 45 points in each group, so the groups overlap a lot.
The groups also differ in ways the chart cannot show. About three in four rides by riders under 20 came from a single venue, where riders of every age group rode less steadily than riders of the same age elsewhere; leave that venue out and every group's median rises, but the pattern across the age groups stays much the same. In the other direction, more than a quarter of the rides by riders in their 50s came from a few days at another venue, where riders rode very steadily; without those rides, the 50s median is 81, level with riders aged 60 and over. We are sharing the numbers as they are and will update them as more rides come in.
How female and male riders compare
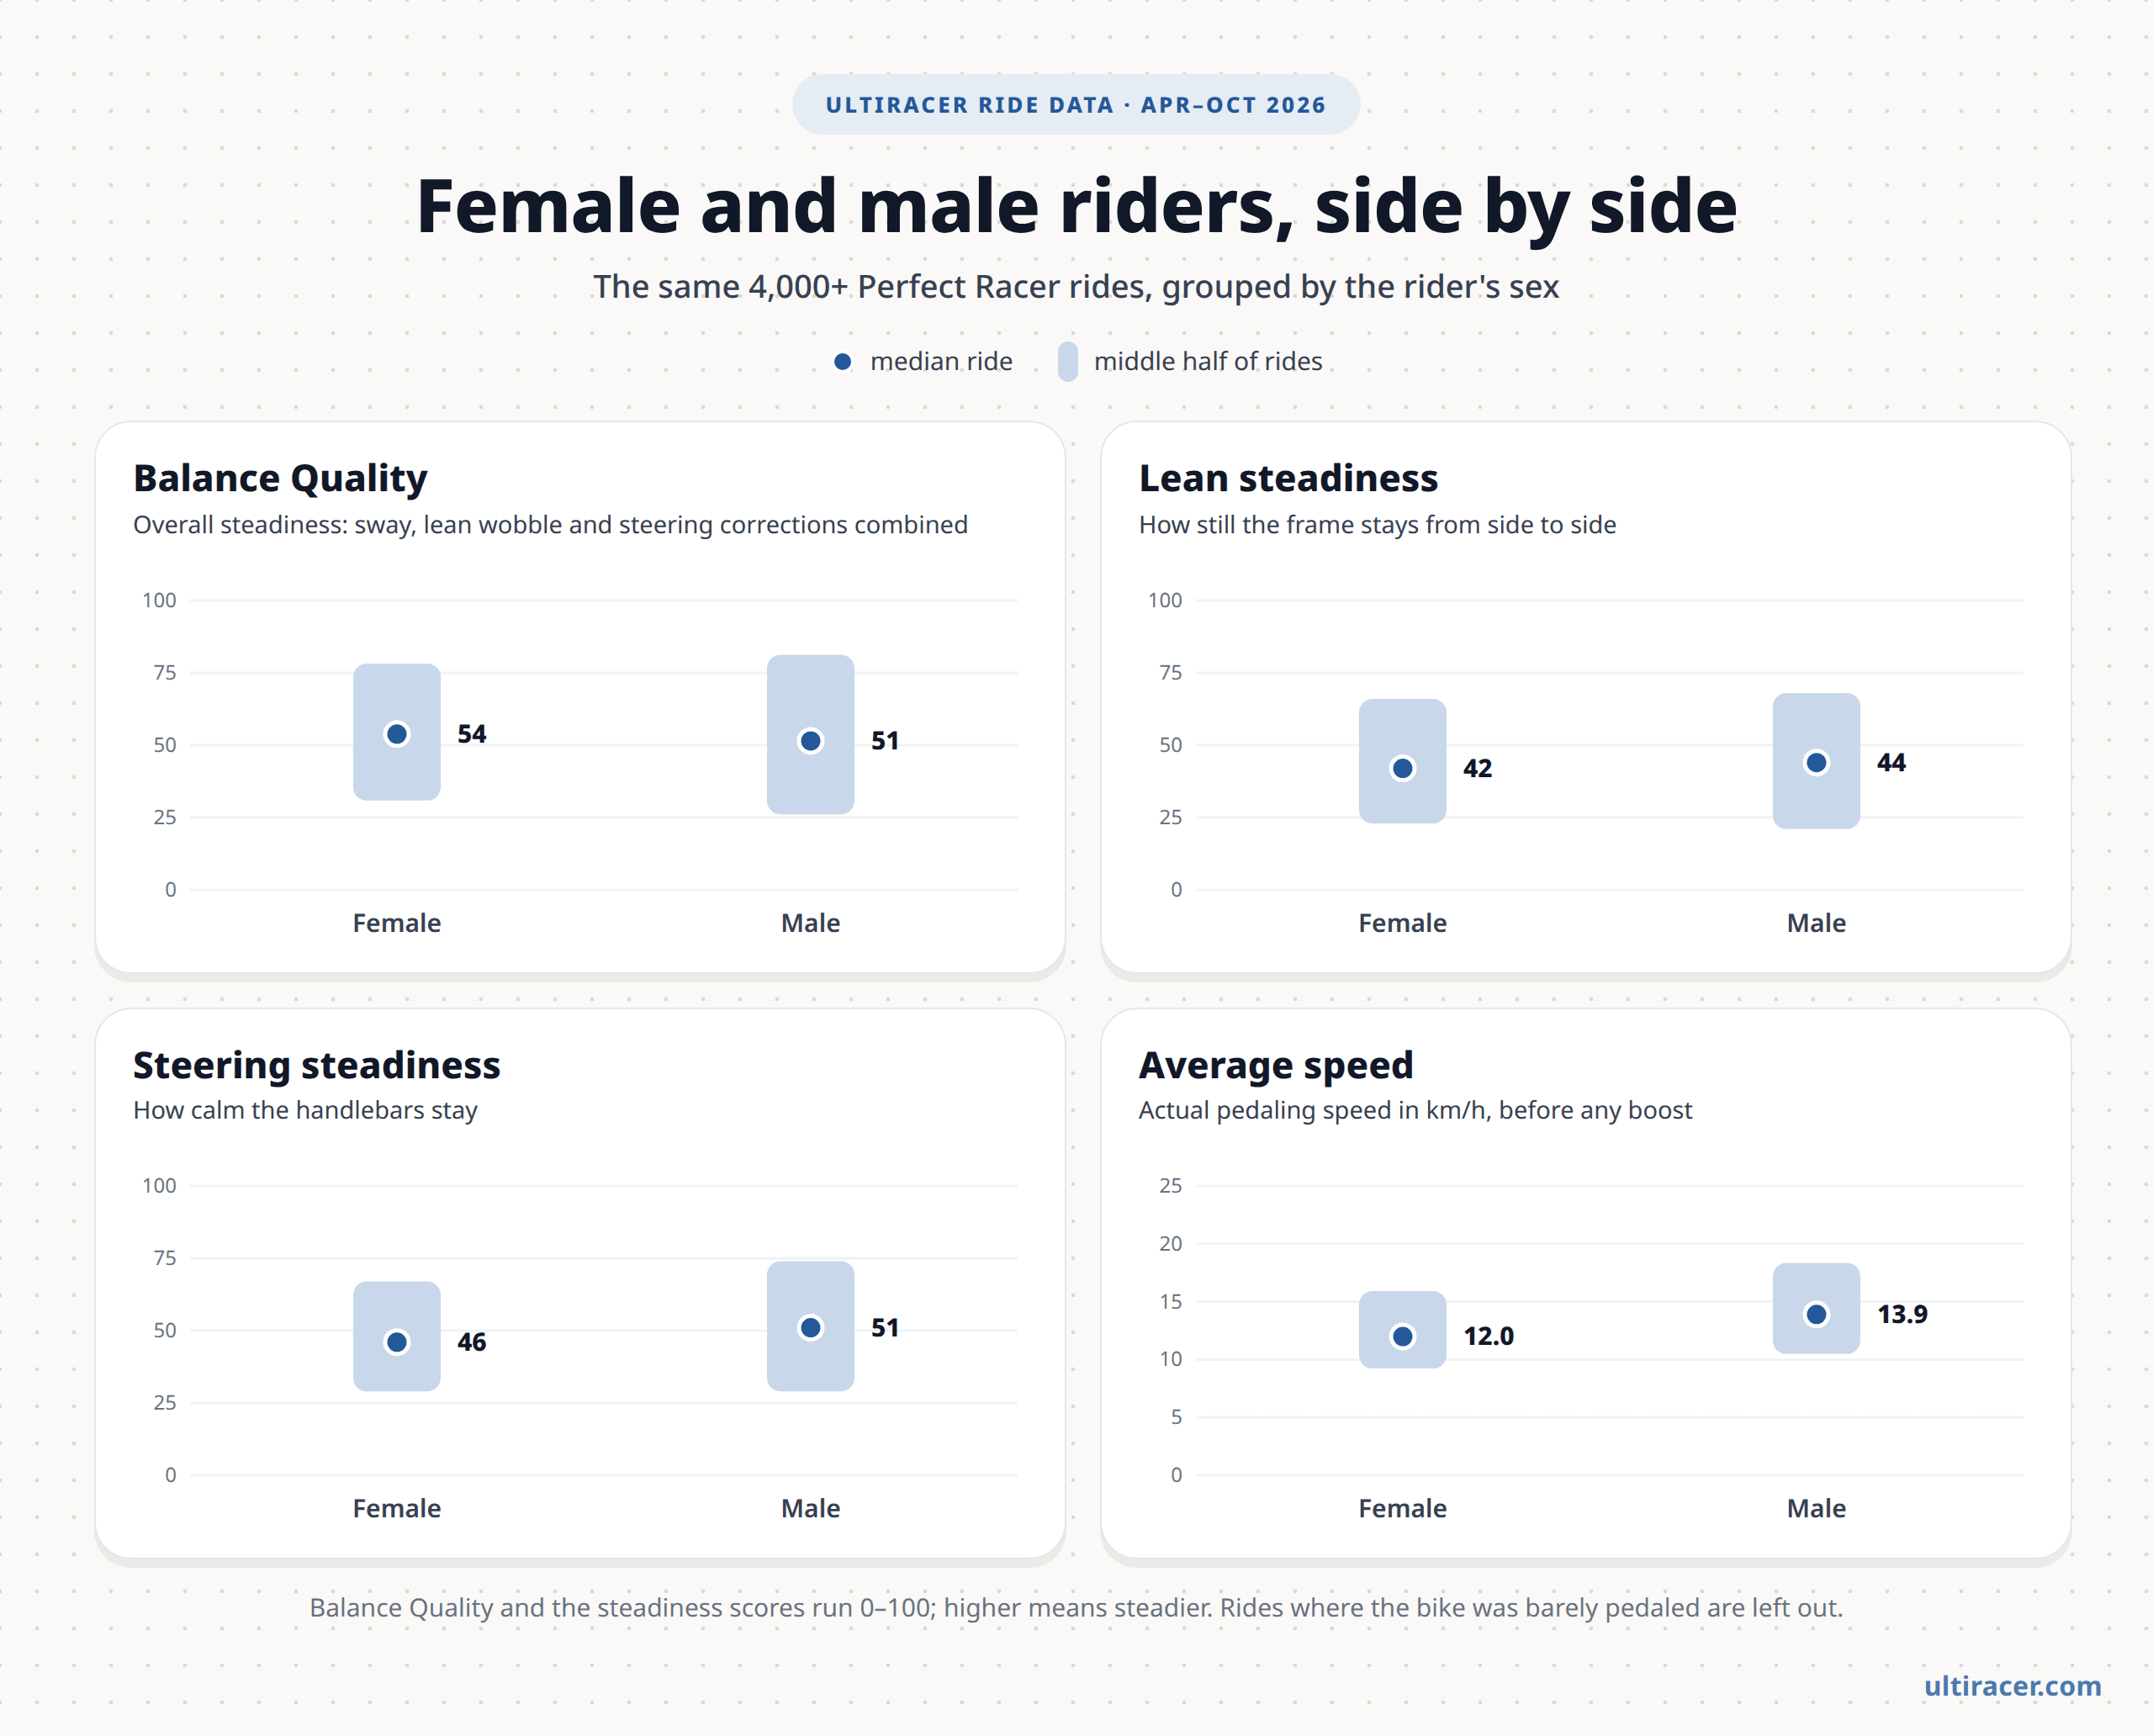
About 3 in 10 of the same rides were by female riders and 7 in 10 by male riders. Here is how the two compare:
- Balance Quality is about the same. The median is 54 for female riders and 51 for male riders, and the middle half of rides covers a similar range. Comparing riders of the same age at the same venue, the gap stays within a few points and goes one way about as often as the other. Among riders aged 60 and over, the female riders' median is slightly higher (85 against 82).
- Female riders pedaled at a gentler pace. Their typical average speed was 12.0 km/h, against 13.9 km/h for male riders, and it was lower in every age group. The gap was widest among riders aged 60 and over: about 10 km/h against 12.5 km/h.
- Male riders' handlebars were slightly calmer. The median steering steadiness is 51 for male riders and 46 for female riders, and the gap narrows when age and venue are matched. Lean steadiness is almost the same (44 and 42).
- Steering styles differ among adults. Between the ages of 20 and 59, about 4 in 10 rides by male riders showed a clear steering style, against about 3 in 10 by female riders.
Single age groups can show bigger gaps. In the 50s, for example, the male riders' median Balance Quality is well above the female riders'. But in that group women and men mostly rode at different venues, and at the venues where both rode, the gap went one way at one venue and the other way at another. As with age, we describe what the data shows and leave the interpretation open.
Try Perfect Racer
Perfect Racer is available on Ultiracer kiosks. It suits wellness centers, senior centers, gyms, schools and events: a ride takes 30 seconds by default, the platform keeps riders upright so anyone who can ride a bike can play, and the results explain themselves. Want to see how your members, guests or visitors ride? Get in touch with us to try Ultiracer at your facility or event, or to talk about research.
References
- Cain, S. M., Ashton-Miller, J. A., & Perkins, N. C. (2016). On the skill of balancing while riding a bicycle. PLOS ONE, 11(2), e0149340. https://doi.org/10.1371/journal.pone.0149340
- Kang, S., Park, J.-W., Kim, Y., Moon, J., Lee, Y., Lee, C.-N., Kim, J., Kim, S.-J., & Kim, B.-J. (2025). Biomechanical analysis of patients with mild Parkinson's disease during indoor cycling training. Journal of NeuroEngineering and Rehabilitation, 22, 127. https://doi.org/10.1186/s12984-025-01657-1
- Kim, Y., Kim, J., Kang, S., Lee, Y., Moon, J., Park, J.-W., Kim, B.-J., & Kim, S.-J. (2025). Convolutional neural networks-based early Parkinson's disease classification using cycling data from a steerable indoor bicycle. Scientific Reports, 15, 43253. https://doi.org/10.1038/s41598-025-27193-5